
The problem all drives will face
Computer storage drives are getting bigger. These days, typical hard drives range from 1 to 8 terabytes without blinking an eye (1,2), with Seagate drives having averaged 6.1 Terabytes in late 2021. However, this bigger capacity also means two things. One, you can lose more data than ever before when a hard drive fails. This can mean losing engineering documents, design projects, or client files. Two, if a hard drive was part of a RAID array, you will need a lot of time to rebuild it if it fails. A 1 terabyte drive can cost an organization an entire day to rebuild (3). This can mean loss of productivity while people are waiting for the data to become accessible again. Despite modern drives being fairly robust, they still fail from time to time. The data center Backblaze reported an annualized failure rate of 1.22% for the first quarter of 2022, with figures ranging from 0 to 24% depending on the drive model (4).
Pros and cons of various methods in addressing drive failures
Today, there are four main ways to address drive failures: a) having data redundancy, b) replacing drives on a regular basis, c) anticipating failures with threshold-based methods, and d) anticipating failures with machine learning algorithms. Each method has its benefits and drawbacks.
Data redundancy
The basic idea with data redundancy is that you create multiple copies of your data so that if one or more storage drives fail, you still have your data saved on one or more other storage drives. Data redundancy can take on a few different forms.
You can make your data redundant by setting up a redundant array of independent disks (i.e. RAID) array. In certain RAID array configurations (not all RAID configurations offer data redundancy) you can have data redundancy through either mirroring or parity. Mirroring produces data redundancy by writing entire copies of the data onto different drives. Parity produces data redundancy by having the bits across multiple drives in a RAID array add up to either an even or odd number. This way, if a single drive fails, its data can be reconstructed by the knowledge that the bits should either add up to an even or odd number. In addition to data redundancy, using RAID has the added benefit of distributing wear across drives.
You can also make your data redundant by regularly backing up your data. The backups can either be saved on your own hardware such as external drives and network attached storage devices or uploaded to a cloud service. However, a backup can only protect against data loss up until the last time that it occurs. The amount of data that is lost when relying on a backup strategy will depend on how often the backups occur. Many small to medium organizations will back up their data once per day (5).
The main benefit of data redundancy is that it offers good protection against data loss. A simple example of this is if you have two drives configured as RAID 1 (which mirrors data), and each drive has a 1.22% chance of failure in any given year, then the probability of you losing data due to drive failure is only 0.015% per year.
What data redundancy does not offer is any kind of warning as to when drive failures will occur. In the previous two-drive example, while the chance of losing data due to drive failure is only 0.015%, the chance that at least one drive will fail is actually greater than the chance of experiencing drive failure if you only have a single drive (i.e. 2.4%). When a drive does fail, chances are that you will want to replace it and rebuild it with the original information. And as mentioned earlier, rebuilds can take a substantial amount of time.
Regular scheduled replacement
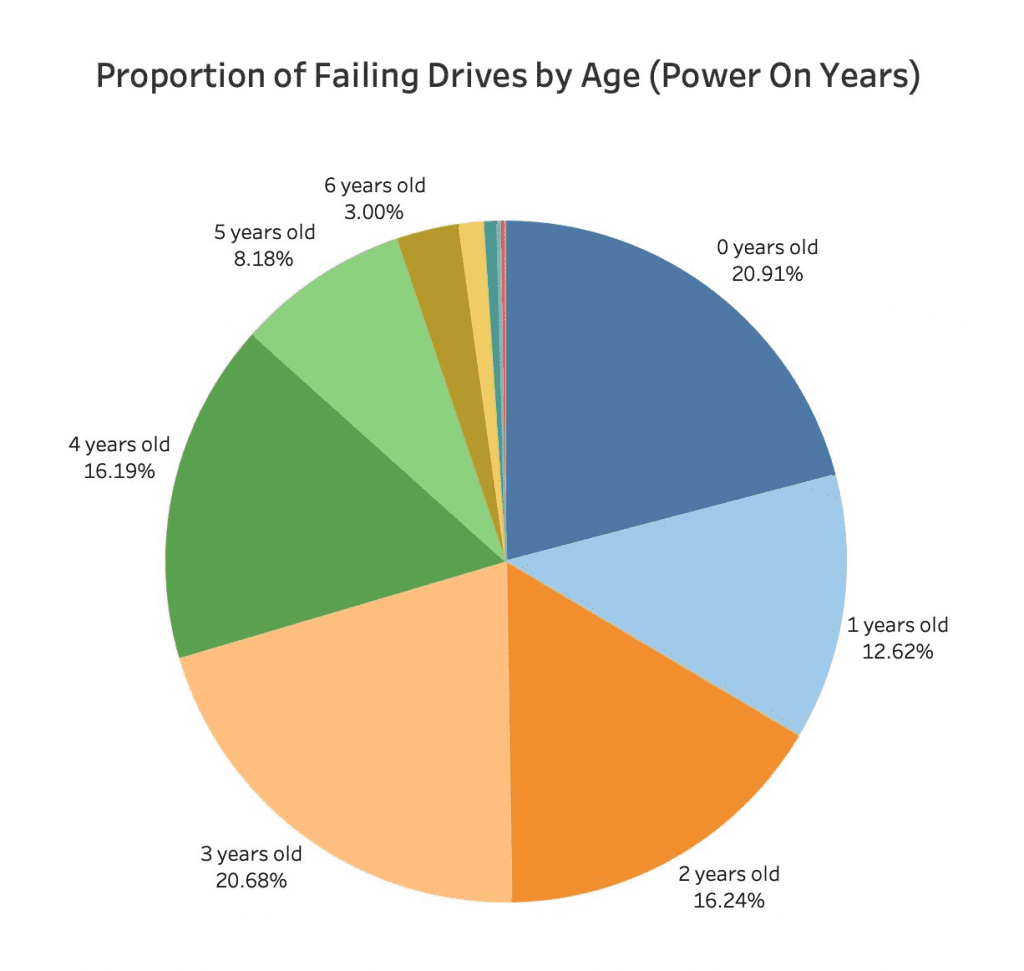
Another way to deal with failing drives is to simply replace all drives periodically. This approach can be seen in data centers, that often replace their drives every 1 to 6 years (6). This approach can trim away drive failures due to older drives, which may have experienced higher wear than younger drives.
However, young drives can also fail. If we examine a recent distribution of drive failures from 2021 in NAS systems out in the real world, we can see that many fail before they reach 1 year old (7). So, if you replace your drive annually, you would still experience the drive failures that occur in drives under 1 year old.
Anticipating drive failures with threshold-based methods
Drive failures can also be anticipated to a certain extent by monitoring drive health indicators and looking out for when they pass certain thresholds. Drive health indicators include Self-Monitoring, Analysis, and Reporting Technology (SMART) attributes as well as a host of other drive health statistics reported by the computing system and the drive itself.
Each SMART attribute comes with various pieces of information, including raw values, normalized values, and sometimes thresholds for “trip” values and/or pre-fail flags. Normalized SMART values range between 0 and 255 (though are often presented in hexadecimal), with ideal values typically at or above 100. However, the meaning of individual SMART attributes and their specific values have not been standardized across manufacturers. This means that a SMART value in one drive may not mean the same thing as the same SMART value in another drive. Sometimes SMART attributes will come with trip values. When the normalized SMART values drop below these trip values, it may indicate that the drive is about to fail in the near future. The original intent behind SMART trips is to warn about failures in the next 24 hours (8,9). Sometimes, SMART attributes will also come with a pre-fail flag. This flag indicates that if the SMART attribute trips, it is considered by the manufacturer to be a severe condition for the drive.
Several other drive health indicators exist. These drive health indicators are sometimes better standardized than SMART attributes, with organizations like the American National Standard of Accredited Standards Committee publishing specifications like the Information Technology ATA/ATAPI Command Set that manufacturers can refer to in designing their drives, though they may not be as conveniently obtainable as SMART attributes.
Drive failures can be anticipated sometimes by thresholding SMART attributes and other drive health indicators. For example, we can decide that a drive is in danger of failing if its raw SMART 197 (Current Pending Sector Count) value rises above 0, or its normalized value drops below 100, or if it trips. Similarly, we can decide that a drive is in danger of failing if its SATA Device Error Count rises above 0.
Using threshold-based methods also has the potential advantage of explaining the reason behind a drive’s deterioration. For example, if a drive’s SMART attribute 9 rose above some threshold, you might conclude that is performing poorly due to old age. This interpretability is one reason why technically proficient users might choose to handle drive failures with a threshold-based approach.
However, anticipating drive failures using threshold-based methods is not a simple matter. Doing so requires choosing one or more appropriate drive health indicators to focus on and defining thresholds that will maximize true positives while minimizing false positives. And the differences are not trivial. For example, if we relied on SMART trips to determine drive failures, we would only be able to catch about 3-10% of drive failures (7,8). Alternatively, if we relied on threshold-based alerts from DA Drive Analyzer ®, we would be able to catch 65% of drive failures, though it comes with a much higher false positive rate.
Furthermore, threshold-based approaches often only consider the health of the drive using snapshots in time. For example, SMART 5 (reallocated sector count) is based on the latest value of reallocated sector count, but does not tell you anything about its change over time, which can be pertinent to drive failures.
Anticipating drive failures with machine learning
The final way to deal with drive failures is by predicting drive failures with machine learning, for example using DA Drive Analyzer’s ® AI-based alerts. Machine learning approaches can leverage multiple drive health indicators simultaneously, including their interactions, as well as patterns of drive health information over time. Furthermore, they come balanced between true positives and false positives out of the box.
An example of the out-of-the-box pre-balancing of true positive and false positive can be seen below in a comparison between various drive failure prediction approaches. Other than DA Drive Analyzer’s ® machine learning approach (DA AI), the other methods are threshold-based methods of drive failure anticipation. In general, we wish to see true positives as high as possible, while keeping false positives as low as possible.
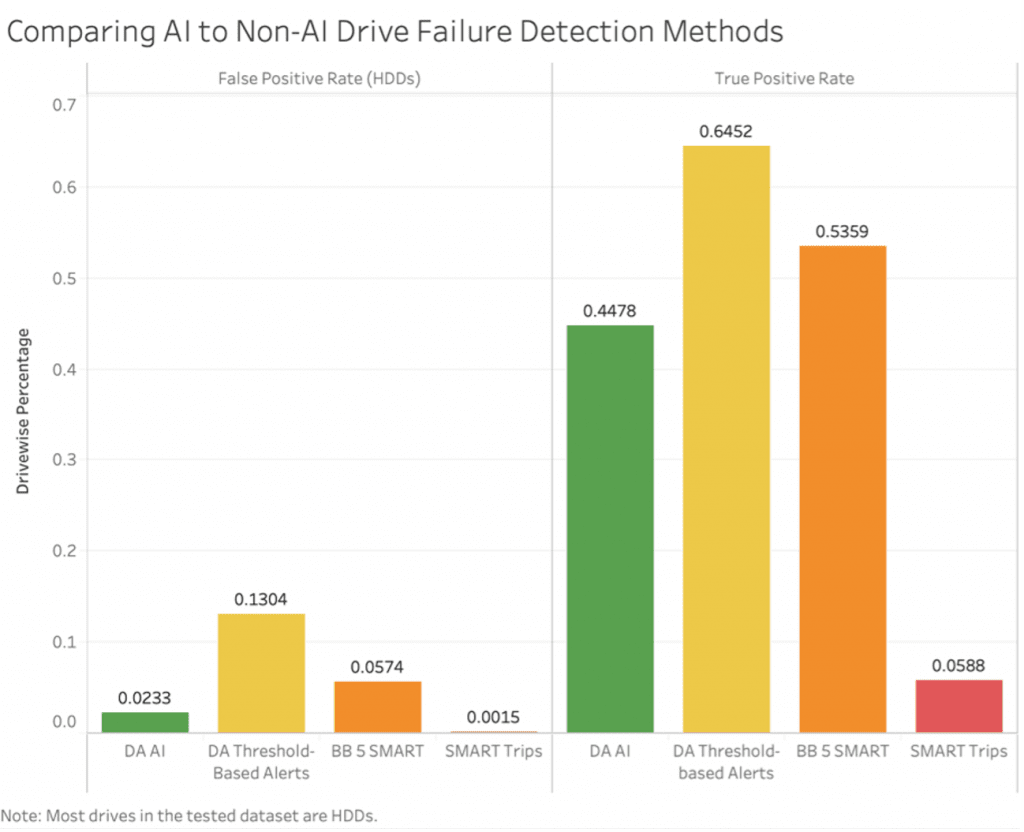
As shown above, a machine learning approach, while perhaps not catching as many failures as some threshold-based methods, is able to achieve a relatively high true positive rate, while keeping false positives to an acceptably low level.
DA Drive Analyzer
DA Drive Analyzer ® is a software as a service developed by ULINK Technology that helps users handle drive failures by anticipating them through threshold-based methods (recommended for advanced users) or machine learning (recommended for casual users). It can be used in conjunction with data redundancy and/or scheduled drive replacement to produce robust protection against drive failures, while offering preparation time that data redundancy alone lacks, and protection against failures in young drives that scheduled drive replacement alone cannot prevent. Furthermore, it provides an automated and comprehensive method for collecting several drive health indicators (some of which are better-standardized than SMART). It also comes with an email-based push notification feature linked to its machine learning and threshold-based algorithms. And it gives users a centralized online dashboard for viewing their drives’ health from multiple systems.
Ultimately, the approach that a user takes to address computer storage failure will depend on their tolerance for failure, the importance of their data, and many other considerations. Each approach has its benefits and drawbacks. The important thing is to be aware that drive failure is an issue all drives will eventually face, and to be ready for it when it happens.
References:
1. https://www.statista.com/statistics/795748/worldwide-seagate-average-hard-disk-drive-capacity/
2. https://en.wikipedia.org/wiki/History_of_hard_disk_drives
3. From communications with QNAP Systems, Inc.
4. https://www.backblaze.com/blog/backblaze-drive-stats-for-q1-2022/?utm_source=google&utm_medium=cpc&utm_campaign=17144914288&utm_content=135913153586&utm_term=backblaze%20hard%20drive%20failure&hsa_acc=1463643725&hsa_cam=17144914288&hsa_grp=135913153586&hsa_ad=596192520133&hsa_src=g&hsa_tgt=kwd-1677883696274&hsa_kw=backblaze%20hard%20drive%20failure&hsa_mt=e&hsa_net=adwords&hsa_ver=3&gclid=Cj0KCQjw-JyUBhCuARIsANUqQ_L0cY4504HU14TfhHjkokwu5hJz8ee63NhdII3v66RA9aHVZasjaH0aAk-7EALw_wcB
5. https://www.acronis.com/en-us/blog/posts/data-backup/
6. https://www.statista.com/statistics/1109492/frequency-of-data-center-system-refresh-replacement-worldwide/
7. Analysis of data from QNAP Systems by ULINK Technology.
8. Zhang, T., Wang, E., & Zhang, D. (2019, April). Predicting failures in hard drivers based on isolation forest algorithm using sliding window. In Journal of Physics: Conference Series(Vol. 1187, No. 4, p. 042084). IOP Publishing.
9. Brumgard, C. D. (2016). Substituting Failure Avoidance for Redundancy in Storage Fault Tolerance.
Predict Drive Failure Before It Happens with Our Drive Health Checker
AI-powered drive health monitoring and diagnostic software for HDD & SSD drives on Windows PC, ASUSTOR NAS, and QNAP NAS
Try DA for Windows PCTry DA for ASUSTOR NASTRY DA for QNAP NAS