Modern IT environments depend heavily on storage reliability. From NAS devices and on‑prem servers to hybrid infrastructure supporting critical workloads, hard drives and SSDs remain a foundational layer. Yet many organizations still manage drive health the same way they did a decade ago by reacting only after something breaks.
This is where the maturity curve of infrastructure monitoring becomes relevant. Most teams move through three clear stages over time:
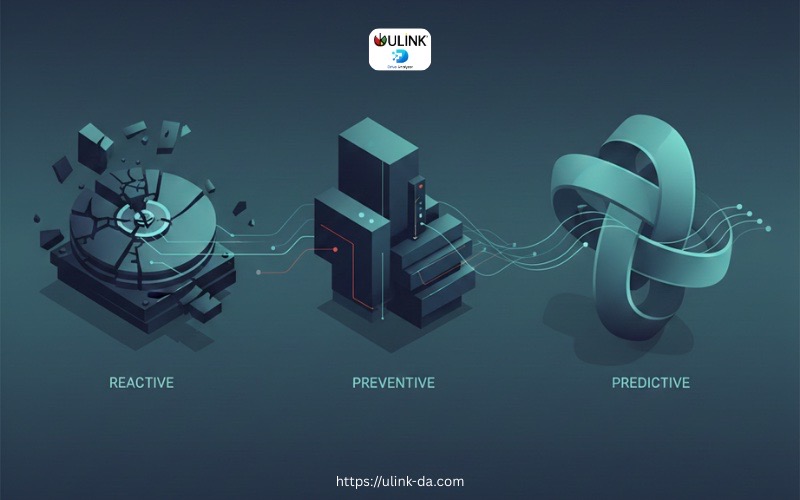
Reactive → Preventive → Predictive
Understanding where your organization sits on this curve can help you reduce downtime, avoid data loss, and make smarter infrastructure decisions.
Stage 1: Reactive Monitoring
Reactive monitoring is where most IT teams begin, often unintentionally.
In this stage, issues are addressed after failure occurs. A drive crashes, files corrupt, or a system becomes unresponsive. Only then does the investigation begin.
Common characteristics
- Alerts triggered only when systems go offline
- Manual checks performed after user complaints
- Limited visibility into drive health beyond basic OS warnings
- Dependence on break‑fix workflows
For storage environments, this often looks like discovering a failed HDD only after:
- A NAS volume goes offline
- A RAID rebuild fails
- Users report missing or inaccessible files
The cost of staying reactive
While reactive monitoring may feel manageable in small environments, it carries hidden risks:
- Unplanned downtime
- Emergency replacements
- Risk of permanent data loss
- Stressful incident response cycles
Most importantly, reactive monitoring provides no early warning. By the time a failure is visible, options are already limited.
Stage 2: Preventive Monitoring
Preventive monitoring represents a step forward. At this stage, teams attempt to catch issues earlier by watching known indicators.
This approach focuses on maintenance and thresholds, rather than waiting for outright failure.
Common characteristics
- SMART attribute monitoring
- Scheduled disk health checks
- Capacity and performance thresholds
- Periodic log reviews
For HDDs and SSDs, preventive monitoring typically includes:
- Tracking reallocated sectors
- Monitoring read/write error rates
- Watching temperature spikes
- Reviewing SMART warnings
Why preventive monitoring helps but isn’t enough
Preventive monitoring reduces surprises, but it still relies heavily on:
- Static thresholds
- Manual interpretation of alerts
- Experience‑based decision making
Two drives may show similar SMART warnings, yet behave very differently. One might fail in days, another might run for months. Preventive systems rarely answer the most important question:
When should this drive actually be replaced?
As environments scale and storage density increases, this uncertainty becomes a growing operational risk.
Stage 3: Predictive Monitoring
Predictive monitoring is the highest level of maturity. Instead of reacting to alerts or manually interpreting metrics, teams use data‑driven intelligence to anticipate failures before they occur.
This stage focuses on understanding patterns over time, not just isolated signals.
What changes at the predictive stage
- Historical drive behavior is continuously analyzed
- Multiple indicators are evaluated together
- Failure risk is assessed probabilistically
- Replacement decisions are proactive and planned
Rather than asking, “Is something wrong right now?” predictive monitoring asks:
“What is likely to fail next, and when?”
This shift is especially critical for NAS environments and mixed HDD/SSD fleets where failures rarely follow identical paths.
Where ULINK DA Fits on the Curve
ULINK DA Drive Analyzer is designed specifically for organizations ready to move into the predictive stage of infrastructure maturity.
Instead of relying solely on static SMART thresholds or manual log reviews, ULINK DA uses AI‑driven analysis to interpret drive behavior holistically.
Key capabilities
- Continuous monitoring of drive health indicators
- Analysis of historical failure patterns across HDDs and SSDs
- Predictive insights that highlight drives at risk before failure
- Clear guidance on when replacement should be planned
By learning from real‑world failure data, ULINK DA helps IT teams distinguish between:
- Drives that look risky but remain stable
- Drives that appear healthy but are approaching failure
This removes guesswork from storage operations.
Practical Benefits for IT and Infrastructure Teams
For IT administrators, storage engineers, and operations managers, predictive monitoring changes day‑to‑day workflows.
Reduced downtime
Planned replacements replace emergency incidents, minimizing service disruption.
Smarter maintenance planning
Drive replacements can be scheduled alongside maintenance windows instead of rushed during outages.
Improved data protection
Early action significantly lowers the risk of unrecoverable data loss.
Clear reporting
Actionable reports support confident decision‑making and help align IT teams with leadership expectations.
For small to mid‑sized organizations, this level of visibility was traditionally difficult to achieve without enterprise‑grade tooling. Predictive analytics makes it accessible.
Moving Up the Maturity Curve
Every organization starts somewhere on the maturity curve. The goal isn’t perfection. It is progression.
- Reactive teams regain control by adopting basic visibility
- Preventive teams stabilize operations with early indicators
- Predictive teams operate with foresight and confidence
As storage environments grow more complex and data becomes more critical, predictive monitoring is no longer optional. It’s a natural next step.
ULINK DA enables that transition by turning drive health data into clear, forward‑looking insight helping teams act before failure becomes a crisis.
Predict Drive Failure Before It Happens with Our Drive Health Checker
AI-powered drive health monitoring and diagnostic software for HDD & SSD drives on Windows PC, ASUSTOR NAS, and QNAP NAS
Try DA for Windows PCTry DA for ASUSTOR NASTRY DA for QNAP NAS