Drive detected issues are the drive health metrics collected and reported by the drive itself. This would be similar to the alerts or measurements shown by a car like its speed, fuel levels, or tire pressure. A drive has sensors to track its activities and whether those activities exceed normal bounds. Examples of drive detected issues include the number of reallocated logical sectors and the number of high-priority unload events (covered in more detail in an earlier post).
To find drive-detected issues, go to DA Portal and on the side menu, select the Slot for which you want to view the issues, and then click on the Threshold-Based Alerts tab.
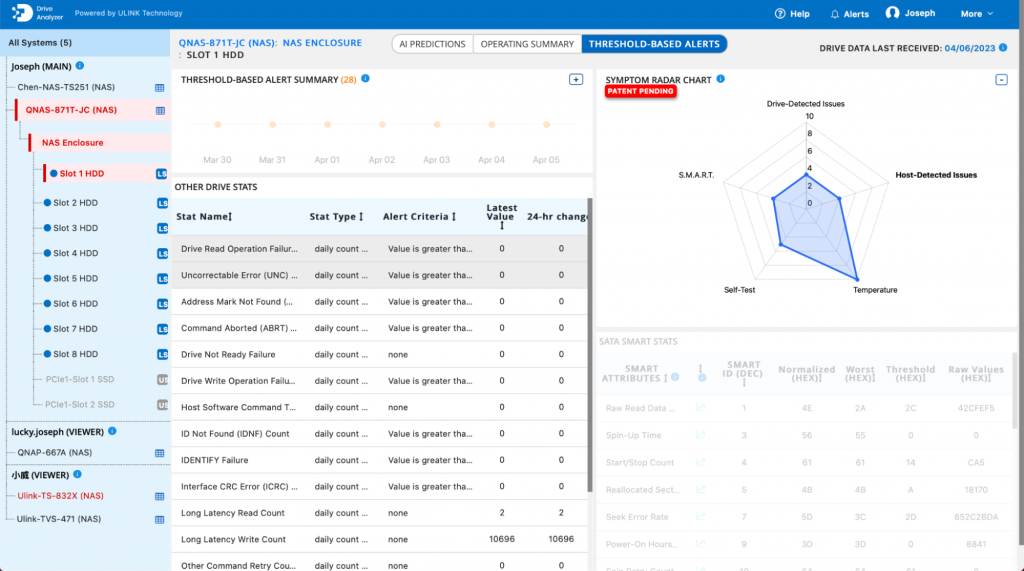
Expand the Symptom Radar Chart graphic and click on the Drive-Detected Issues axis. Drive-detected issues will be highlighted on the page.
This story is part of a series:
Features of DA Drive Analyzer: User Interface for NAS App
Features of DA Drive Analyzer: User Interface for DA Portal
Features of DA Drive Analyzer: User Interface for DA Desktop Suite
Features of DA Drive Analyzer: Decoding Drive Performance With AI-Based Predictions
Features of DA Drive Analyzer: Exploring the Science of Your Drive
Features of DA Drive Analyzer: Drive Health Overview with ULINK Symptom Radar Chart
Features of DA Drive Analyzer: Set Up Alerts to Make the Most of AI-Based Data
Features of DA Drive Analyzer: Understanding Host and Drive Detected Issues
Features of DA Drive Analyzer: Locating Host Detected Issues on DA Portal
Features of DA Drive Analyzer: Locating Drive Detected Issues on DA Portal
In a data dependent world, the ULINK DA Drive Analyzer AI algorithms disrupt drive failure prediction with 7-8 times more effectiveness than traditional systems.
DA Drive Analyzer Free Beta Version Now Available for Windows PC
DA Drive Analyzer Now Available for ASUSTOR NAS Users
Predict Drive Failure Before It Happens with Our Drive Health Checker
AI-powered drive health monitoring and diagnostic software for HDD & SSD drives on Windows PC, ASUSTOR NAS, and QNAP NAS
Try DA for Windows PCTry DA for ASUSTOR NASTRY DA for QNAP NAS